| PARTICULARS FOR MECHANICAL PROPATIES TEST |
| |
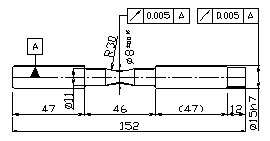
| Pure bending test properties |
| |
| Table.1 Test piece properties |
| Hardness |
HRC36,60 |
| Geometry |
 |
|
|
| |
| Tension test properties |
| Table.2 Test piece properties |
| Hardness |
HRC36,60 |
| Geometry |
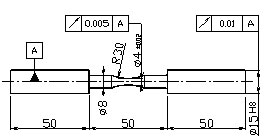
For HRC36
For HRC60 |
|
|
| |
| Table.3 Mechanical properties for piece |
Rockwell hardness [HRC] |
N (35.6, 1.452) |
N (60, 0.652) |
Proportional limit for bending [GPa] |
N (0.947, 0.552) |
N (2.38, 0.532) |
Tensile strength [GPa]
|
N (1.09, 0.0142) |
N (2.1, 0.122) |
|
| |
| |
| Table.4 Heat treatment conditions of SUJ2 steel |
Hardness |
Normalizing |
Quenching |
Tempering |
HRC36 |
- |
830℃/20min |
170℃/120min |
HRC60 |
- |
830℃/20min |
600℃/90min |
|
|
| |
| Table.5 Chemical composition (mass%, O: ppm) |
| |
C |
Si |
Mn |
P |
S |
Cr |
Mo |
Ni |
Cu |
O |
| Product analysis |
0.98 |
0.18 |
0.37 |
0.016 |
0.003 |
1.42 |
0.03 |
0.07 |
0.12 |
6 |
| Requierment |
Max |
1.10 |
0.35 |
0.50 |
0.03 |
0.03 |
1.60 |
0.08 |
- |
- |
- |
| Min |
0.95 |
0.15 |
|
|
|
1.30 |
|
|
|
|
|
|
| |
| Table.6 Mechanical properties for test piece |
No |
Hardness[HRC] |
|
No |
Pure Bendin
Proportional limit[GPa] |
|
No |
Tensile strength[GPa] |
HRC36 |
HRC60 |
|
HRC36 |
HRC60 |
|
HRC36 |
HRC60 |
1 |
32.420 |
58.520 |
|
1 |
0.768 |
2.186 |
|
1 |
1.051 |
1.812 |
2 |
32.660 |
58.980 |
|
2 |
0.776 |
2.216 |
|
2 |
1.072 |
1.857 |
3 |
32.740 |
59.000 |
|
3 |
0.776 |
2.272 |
|
3 |
1.073 |
1.902 |
4 |
34.120 |
59.075 |
|
4 |
0.790 |
2.332 |
|
4 |
1.079 |
1.917 |
5 |
34.260 |
59.080 |
|
5 |
0.826 |
2.344 |
|
5 |
1.088 |
1.985 |
6 |
34.280 |
59.620 |
|
6 |
0.840 |
2.352 |
|
6 |
1.088 |
2.005 |
7 |
34.300 |
59.680 |
|
7 |
0.899 |
2.360 |
|
7 |
1.088 |
2.019 |
8 |
34.740 |
59.720 |
|
8 |
0.921 |
2.369 |
|
8 |
1.089 |
2.023 |
9 |
34.840 |
59.880 |
|
9 |
0.935 |
2.373 |
|
9 |
1.089 |
2.033 |
10 |
35.320 |
59.900 |
|
10 |
0.955 |
2.375 |
|
10 |
1.090 |
2.043 |
11 |
35.400 |
59.940 |
|
11 |
0.975 |
2.379 |
|
11 |
1.092 |
2.054 |
12 |
35.440 |
59.940 |
|
12 |
0.995 |
2.405 |
|
12 |
1.093 |
2.071 |
13 |
35.520 |
59.940 |
|
13 |
0.995 |
2.413 |
|
13 |
1.094 |
2.075 |
14 |
35.600 |
60.000 |
|
14 |
0.995 |
2.427 |
|
14 |
1.095 |
2.080 |
15 |
35.600 |
60.000 |
|
15 |
1.005 |
2.431 |
|
15 |
1.095 |
2.083 |
16 |
35.620 |
60.040 |
|
16 |
1.084 |
2.433 |
|
16 |
1.095 |
2.083 |
17 |
35.800 |
60.220 |
|
17 |
1.114 |
2.439 |
|
17 |
1.095 |
2.097 |
18 |
35.820 |
60.280 |
|
18 |
1.154 |
2.465 |
|
18 |
1.096 |
2.100 |
19 |
35.860 |
60.320 |
|
19 |
1.194 |
2.475 |
|
19 |
1.097 |
2.109 |
20 |
35.880 |
60.340 |
|
|
|
|
|
20 |
1.097 |
2.113 |
21 |
36.460 |
60.340 |
|
|
|
|
|
21 |
1.099 |
2.135 |
22 |
36.480 |
60.360 |
|
|
|
|
|
22 |
1.099 |
2.138 |
23 |
36.520 |
60.420 |
|
|
|
|
|
23 |
1.099 |
2.145 |
24 |
36.700 |
60.440 |
|
|
|
|
|
24 |
1.100 |
2.148 |
25 |
36.800 |
60.620 |
|
|
|
|
|
25 |
1.100 |
2.153 |
26 |
36.820 |
60.640 |
|
|
|
|
|
26 |
1.101 |
2.155 |
27 |
36.820 |
60.700 |
|
|
|
|
|
27 |
1.101 |
2.172 |
28 |
37.180 |
60.720 |
|
|
|
|
|
28 |
1.101 |
2.179 |
29 |
37.220 |
60.800 |
|
|
|
|
|
29 |
1.101 |
2.183 |
30 |
37.780 |
60.900 |
|
|
|
|
|
30 |
1.102 |
2.204 |
|
|
|
|
|
|
|
|
31 |
1.107 |
2.216 |
|
|
|
|
|
|
|
|
32 |
1.112 |
2.262 |
|
|
|
|
|
|
|
|
33 |
1.114 |
2.266 |
|
|
|
|
|
|
|
|
34 |
1.114 |
2.275 |
|
|
|
|
|
|
|
|
35 |
1.120 |
2.318 |
|
|
| |
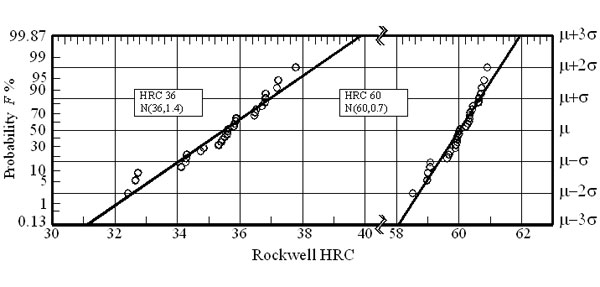 |
| Fig.1 Distribution of Surface hardness |
| |
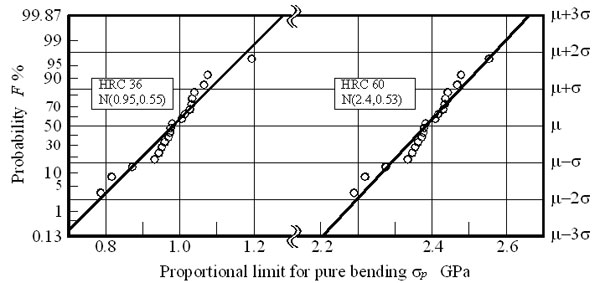 |
| Fig.2 Distribution of Proportional limit for pure bending |
| |
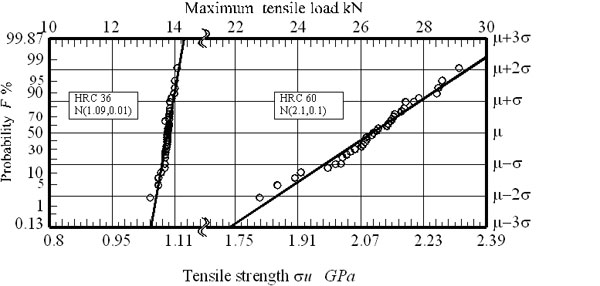 |
| Fig.3 Distribution of Tensile strength |
| |
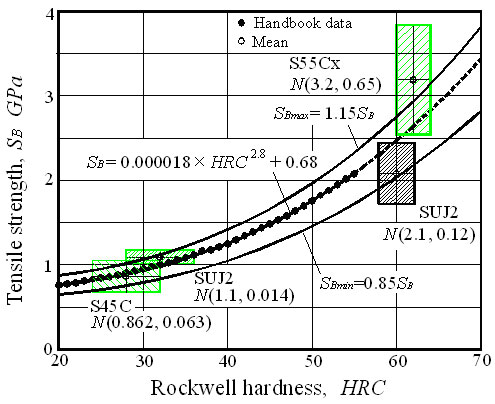 |
| Fig.4 Correlation between Tensile strength and Rockwell hardness |
|
| |
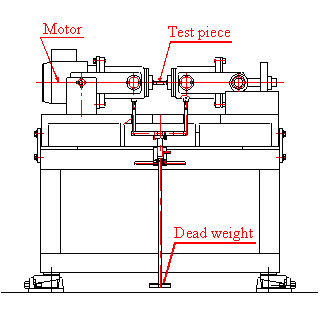
| Table.7 Test machine properties |
Machine type |
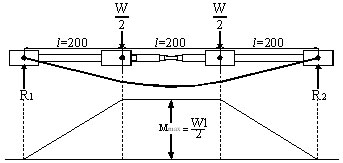
4-point rotating bending |
Motor |
φ3-2p-0.75kw |
Frequency |
0~80Hz |
| |
 |
|
|
| |
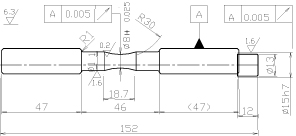
| Table.8 Test piece properties |
| Hardness |
HRC60 |
| Geometry |
 |
|
|
| |
| Table.9 Parameter of Log-normal |
Stress[GPa] |
0.94 |
0.98 |
1.07 |
1.11 |
1.17 |
1.27 |
μ |
17.93 |
17.57 |
15.7 |
15.03 |
14.75 |
12.99 |
σ |
0.53 |
0.64 |
0.77 |
0.63 |
0.68 |
0.76 |
σ/μ |
0.03 |
0.039 |
0.049 |
0.042 |
0.046 |
0.059 |
|
|
| |
| Table.10 Parameter of 2-parameter Weibull |
Stress[GPa] |
0.94 |
0.98 |
1.07 |
1.11 |
1.17 |
1.27 |
m |
2.17 |
1.84 |
1.75 |
1.95 |
1.89 |
1.71 |
εεφση |
77.80 |
54.90 |
9.40 |
4.45 |
3.30 |
0.63 |
|
|
| |
| Table.11 Parameter of 3-parameter Weibull |
Stress[GPa] |
0.94 |
0.98 |
1.07 |
1.11 |
1.17 |
1.27 |
m |
1.5 |
η |
56.47 |
48.41 |
6.24 |
3.57 |
2.31 |
0.5 |
γ |
17.1800 |
5.9600 |
1.0880 |
0.8390 |
0.6900 |
0.0430 |
|
|
| |
| Table.12 Number of cycle to failures of rotating bending fatigue test for SUJ2 steel (HRC60) |
No |
Stress[GPa] |
1.27 |
1.17 |
1.11 |
1.07 |
0.97 |
0.94 |
1 |
8.00×10⁴ |
8.91×10⁵ |
1.28×10⁶ |
3.32×10⁶ |
1.02×10⁷ |
2.32×10⁷ |
2 |
9.90×10⁴ |
1.05×10⁶ |
1.42×10⁶ |
3.50×10⁶ |
1.53×10⁷ |
3.47×10⁷ |
3 |
1.50×10⁵ |
1.17×10⁶ |
1.70×10⁶ |
|
1.78×10⁷ |
3.67×10⁷ |
4 |
1.87×10⁵ |
1.19×10⁶ |
1.81×10⁶ |
4.28×10⁶ |
2.28×10⁷ |
4.29×10⁷ |
5 |
2.14×10⁵ |
1.21×10⁶ |
1.83×10⁶ |
4.54×10⁶ |
2.50×10⁷ |
4.46×10⁷ |
6 |
2.25×10⁵ |
1.22×10⁶ |
2.96×10⁶ |
4.59×10⁶ |
2.58×10⁷ |
4.53×10⁷ |
7 |
2.53×10⁵ |
1.49×10⁶ |
3.21×10⁶ |
4.73×10⁶ |
2.86×10⁷ |
4.99×10⁷ |
8 |
2.95×10⁵ |
1.65×10⁶ |
3.26×10⁶ |
4.87×10⁶ |
2.98×10⁷ |
5.19×10⁷ |
9 |
3.26×10⁵ |
1.69×10⁶ |
3.34×10⁶ |
4.91×10⁶ |
3.01×10⁷ |
5.37×10⁷ |
10 |
3.31×10⁵ |
1.70×10⁶ |
3.38×10⁶ |
5.12×10⁶ |
3.13×10⁷ |
5.80×10⁷ |
11 |
3.44×10⁵ |
1.76×10⁶ |
3.41×10⁶ |
5.63×10⁶ |
3.43×10⁷ |
5.88×10⁷ |
12 |
3.83×10⁵ |
2.05×10⁶ |
4.46×10⁶ |
6.06×10⁶ |
3.44×10⁷ |
6.00×10⁷ |
13 |
4.04×10⁵ |
2.12×10⁶ |
4.47×10⁶ |
7.24×10⁶ |
3.91×10⁷ |
6.83×10⁷ |
14 |
4.12×10⁵ |
2.24×10⁶ |
4.70×10⁶ |
7.72×10⁶ |
4.18×10⁷ |
7.43×10⁷ |
15 |
4.60×10⁵ |
2.30×10⁶ |
4.78×10⁶ |
7.84×10⁶ |
4.56×10⁷ |
7.48×10⁷ |
16 |
4.71×10⁵ |
2.51×10⁶ |
5.35×10⁶ |
7.98×10⁶ |
4.65×10⁷ |
9.06×10⁷ |
17 |
5.12×10⁵ |
2.57×10⁶ |
5.46×10⁶ |
8.35×10⁶ |
4.91×10⁷ |
9.50×10⁷ |
18 |
5.50×10⁵ |
2.67×10⁶ |
8.26×10⁶ |
8.60×10⁶ |
5.19×10⁷ |
1.01×10⁸ |
19 |
5.57×10⁵ |
3.00×10⁶ |
1.13×10⁷ |
8.89×10⁶ |
5.22×10⁷ |
1.21×10⁸ |
20 |
6.59×10⁵ |
3.05×10⁶ |
1.32×10⁷ |
9.21×10⁶ |
5.58×10⁷ |
1.53×10⁸ |
21 |
6.70×10⁵ |
3.46×10⁶ |
|
9.60×10⁶ |
5.66×10⁷ |
|
22 |
6.96×10⁵ |
3.58×10⁶ |
|
1.15×10⁷ |
6.35×10⁷ |
|
23 |
7.18×10⁵ |
3.73×10⁶ |
|
1.16×10⁷ |
6.47×10⁷ |
|
24 |
7.64×10⁵ |
3.99×10⁶ |
|
1.39×10⁷ |
7.11×10⁷ |
|
25 |
7.67×10⁵ |
4.48×10⁶ |
|
1.53×10⁷ |
7.43×10⁷ |
|
26 |
8.57×10⁵ |
5.71×10⁶ |
|
1.95×10⁷ |
8.65×10⁷ |
|
27 |
8.91×10⁵ |
7.33×10⁶ |
|
2.08×10⁷ |
9.08×10⁷ |
|
28 |
1.11×10⁶ |
7.89×10⁶ |
|
2.18×10⁷ |
1.06×10⁸ |
|
29 |
1.27×10⁶ |
8.28×10⁶ |
|
2.22×10⁷ |
1.11×10⁸ |
|
30 |
1.69×10⁶ |
8.37×10⁶ |
|
2.83×10⁷ |
1.50×10⁸ |
|
|
|
| |
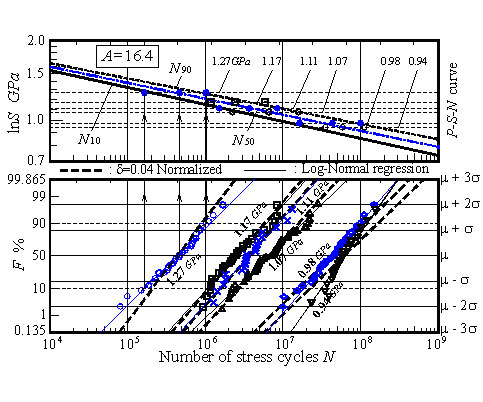 |
| Fig. 5 Life distribution and Log-normal plot, and Log-normal-based P-S-N curve |
| |
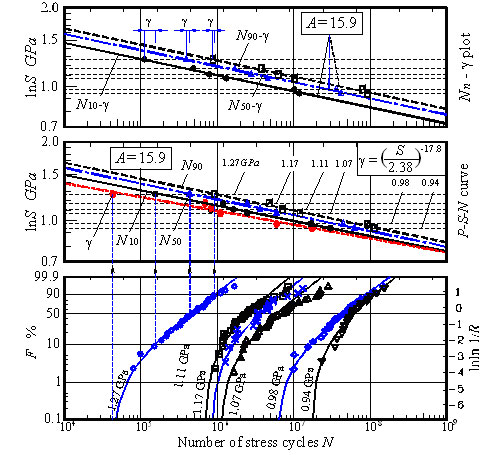 |
| Fig. 6 Life distribution and Weibull plot, and 3-parameter Weibull-based P-S-N curve |
| |
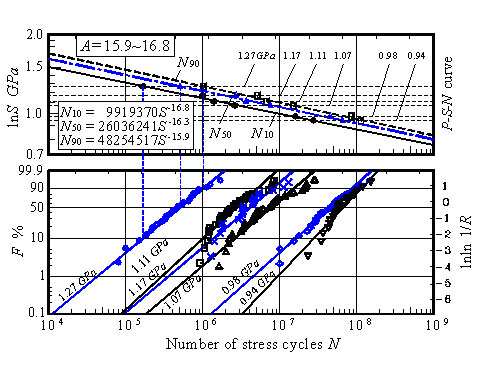 |
| Fig. 7 Life distribution and Weibull plot, and 2-parameter Weibull-based P-S-N curve |
|
| |
| NON-METARIC INCLUSION |
| Table.13 Result of fracture surface[0.98GPa] |
Depth[mm] |
Diameter of inclusion[mm] |
Kind of inclusion |
0.11 |
19.5 |
MgO-CaO-Al2O3 |
0.03 |
6.7 |
TiN |
0.08 |
12.1 |
TiN |
0.47 |
18.4 |
CaO-Al2O3 |
0.03 |
9.7 |
TiN |
0.07 |
8.7 |
TiN |
|
|
| |
| Table.14 Result of fracture surface[1.07GPa] |
Depth[mm] |
Diameter of inclusion[mm] |
Kind of inclusion |
0.02 |
8.1 |
TiN |
0.31 |
14.8 |
TiN |
0.06 |
13.6 |
TiN |
0.01 |
11.2 |
TiN |
0.03
|
9.0 |
TiN |
0.09 |
10.4 |
TiN |
|
|
| |
| Table.15 Result of fracture surface[1.17GPa] |
Depth[mm] |
Diameter of inclusion[mm] |
Kind of inclusion |
0.08 |
15.3 |
TiN |
0.02 |
14.9 |
CaO-Al2O3 |
0.01 |
6.7 |
TiN |
0.36 |
19.5 |
MgO-CaO-Al2O3 |
0.28 |
14.3 |
TiN |
|
|
| |
| Table.16 Result of fracture surface[1.27GPa] |
Depth[mm] |
Diameter of inclusion[mm] |
Kind of inclusion |
0.00 |
9.8 |
TiN |
0.01 |
11.8 |
TiN |
0.24 |
21.5 |
MgO-CaO-Al2O3 |
0.04 |
8.9 |
TiN |
0.04 |
15.0 |
CaO-Al2O3 |
0.05 |
10.2 |
TiN |
|
| |
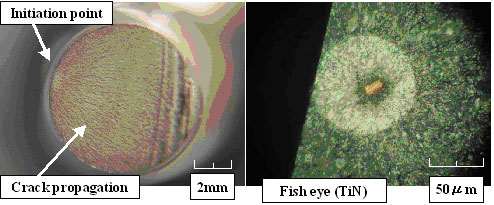 |
| Fig.8 Fatigue failure of 4-point bending test specimen, SUJ2 HRC58‐62 |
| |
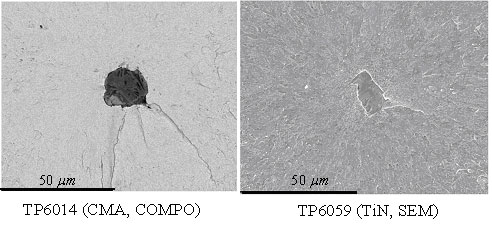 |
| Fig. 9 TP1014 (CaO-MgO-Al2O3), TP6059 (TiN) inclusions and cracks |
| |
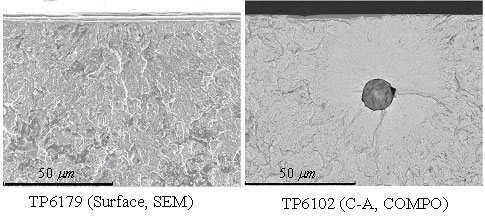 |
| Fig. 10 TP6179 (Surface), TP6102 (CaO-Al2O3) inclusion and its crack |