Machine type |
Crank driven 4-ball spline life test rig |
Motor |
φ3-4p-1.5kw |
Frequency |
0~80Hz |
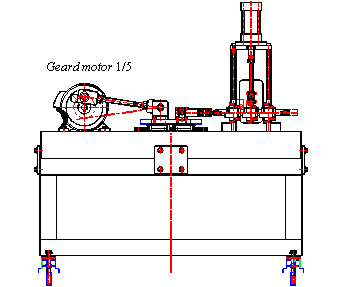
Side view of fatigue life test rig |
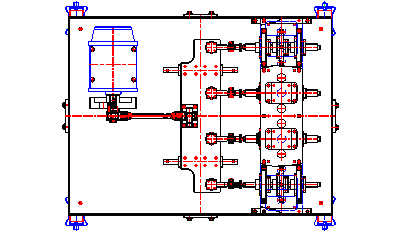
Top view of fatigue life test rig |
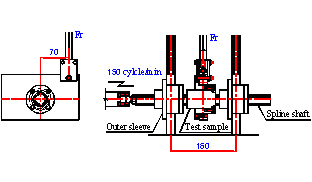
Side view of fatigue life test rig configuration |
|
| |
| Table 1 test piece properties |
Raceway length, mm |
lt = 42.99 |
Number of ball circulations |
j = 6 |
Number of effective balls |
Zt = 9 |
Initial contact angle |
γ = 45゜ |
Ball diameter, mm |
Dw = 4.7625 |
Factor of Ball pitch |
k = 1.003 |
Ball pitch, mm |
tw=kDw = 4.777 |
Conformity factor |
f = 0.52 |
Herzt constant, N/mm1.5 |
Cb =2.3051×10⁵ |
|
|
| |
| Table 2 Test condition |
|
Test1 |
Test2 |
Stroke, mm |
100 |
Test speed, km/h |
1.8 |
Test load, kN
Test torque, Nm
|
1.8
126 |
2.0
140 |
Lubricant |
AFB-LF Grease ( Li-Base ) |
|
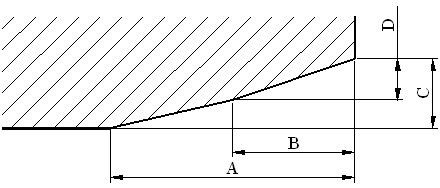 |
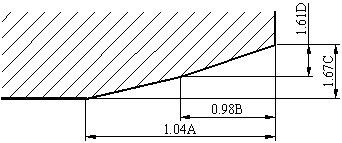
A |
B |
C |
D |
5.275 |
2.020 |
0.024 |
0.013 |
mm |
| Crowning configuration(Test1) |
|
| |
 |
| Crowning configuration(Test2) |
|
| |
| Table4 Paramenters of log-normal |
Load,kN
Torque,Nm |
1.8
126 |
2.0
140 |
μ |
1.76 |
1.58 |
σ |
0.77 |
0.56 |
δ= σ/μ |
0.44 |
0.35 |
|
| |
| Table5 Paramenters of 2-parameter Weibull |
Load,kN
Torque,Nm |
1.8
126 |
2.0
140 |
m |
1.89 |
2.2 |
η |
7.62 |
6.33 |
|
| |
| Table6 Parameter of 3-parameter Weibull |
Load,kN
Torque,Nm |
1.8
126 |
2.0
140 |
m |
10/9 |
η |
737 |
5.24 |
γ |
1.02 |
1.58 |
|
|
| |
| Table7 Travel distance to failure of ball spline(km) |
No |
Test1 |
Test2 |
Load,Torque |
1.8kN
126Nm |
2.0kN
140Nm |
1 |
133.5796 |
166.8866 |
2 |
138.0366 |
226.8084 |
3 |
228.6092 |
260.1674 |
4 |
252.8814 |
279.8192 |
5 |
269.4464 |
296.528 |
6 |
294.2164 |
303.0054 |
7 |
313.7886 |
317.1974 |
8 |
318.6672 |
347.4862 |
9 |
382.0986 |
367.3232 |
10 |
408.5808 |
390.0558 |
11 |
454.1522 |
431.2516 |
12 |
460.0866 |
508.1568 |
13 |
532.733 |
598.0278 |
14 |
539.1016 |
626.862 |
15 |
591.49 |
732.1054 |
16 |
630.1352 |
738.7492 |
17 |
658.2182 |
759.9022 |
18 |
674.7778 |
773.1024 |
19 |
701.9596 |
780.6058
|
20 |
734.4314 |
819.3514 |
21 |
756.363 |
854.2438 |
22 |
856.9874 |
899.9994 |
23 |
943.7046 |
924.0478 |
24 |
996.0938 |
952.5582 |
25 |
1000 |
1000 |
26 |
1000 |
1000 |
27 |
1000(Supention) |
1000 |
28 |
1000 |
1000(Supention) |
29 |
1000 |
1000 |
30 |
1000 |
1000 |
|
|
| |
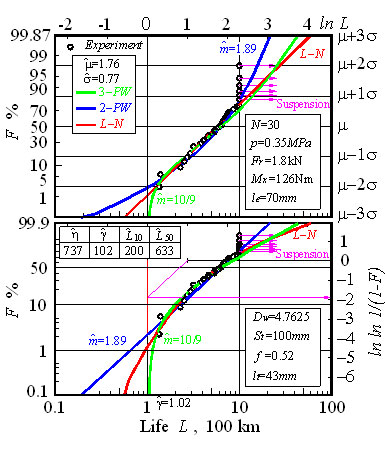 |
Fig. 1 Test 1: Weibull and log-normal plot of ball spline life test
(F=1.8kN ,T=126Nm) |
| |
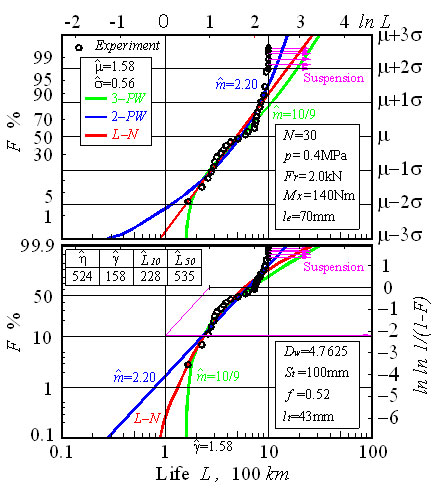 |
Fig. 2 Test 2: Weibull and log-normal plot of ball spline life test
(F=2.0kN ,T=140Nm) |
|
| |
| Table 8 Estimation of C from life distribution |
T, Nm |
126 |
140 |
C2-PW |
162 |
184 |
C3-PW |
123 |
121 |
Cth |
232 |
C2-PW/Cth |
0.70 |
0.79 |
C3-PW/Cth |
0.53 |
0.52 |
|
|
| |
| Table 9 Estimation of C from life distribution |
F, kN |
1.8 |
2.0 |
C2-PW |
2323 |
4475 |
C3-PW |
1875 |
1777 |
Cth |
3399 |
C2-PW/Cth |
0.68 |
1.32 |
C3-PW/Cth |
0.55 |
0.52 |
|
| |
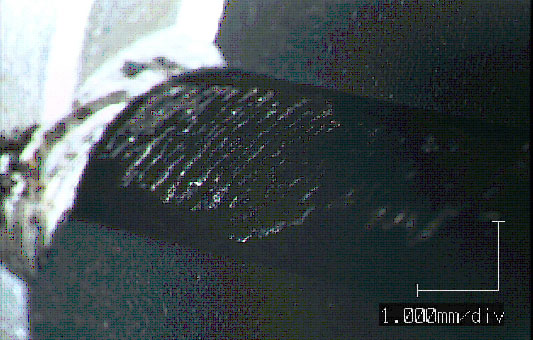 |
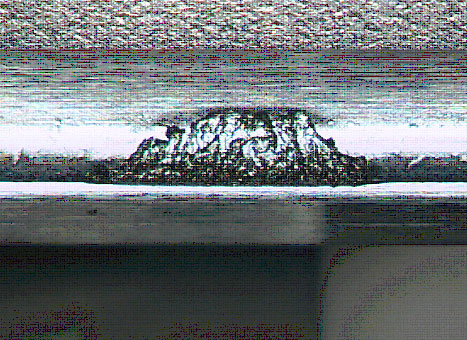
| Fig.3 Spalling initiated on Spline nut end portion |
| |
 |
| Fig. 4 Spalling initiated on Spline shaft |